pyPOCQuant with Jupyter
Demo notebook to show the usage of pyPOCQuant using a Jupyter/IPython notebook.
This is a convinient way to automate the execution of multiple folders and directly analize and plot the results.
[4]:
# Load the relevant dependencies
import os
import sys
import pandas as pd
sys.path.append('..\..')
from pypocquant.lib.pipeline import run_pipeline
from pypocquant.lib.settings import load_settings
from pathlib import Path
import pandas as pd
import seaborn as sns
import matplotlib.pyplot as plt
from IPython.display import Image, display
Next lets load and print the example config
[8]:
p = Path(os.path.abspath('images'))
settings_file_path = Path(p.parent / 'config.conf')
print('The pipeline will be run with the following configuration')
f = open(str(settings_file_path), "r")
print(f.read())
The pipeline will be run with the following configuration
max_workers=4
qc=True
verbose=True
control_band_index=-1
sensor_band_names=('igm', 'igg', 'ctl')
peak_expected_relative_location=(0.31, 0.53, 0.75)
sensor_center=(147, 522)
sensor_size=(45, 215)
sensor_border=(7, 7)
perform_sensor_search=True
qr_code_border=40
subtract_background=True
sensor_search_area=(55, 225)
sensor_thresh_factor=2.0
raw_auto_stretch=False
raw_auto_wb=False
strip_try_correct_orientation=False
strip_try_correct_orientation_rects=(0.52, 0.15, 0.09)
strip_text_to_search=''
strip_text_on_right=False
force_fid_search=False
[9]:
if settings_file_path.exists():
    input_folder_path = Path(p)
    results_folder_path = Path(input_folder_path / 'pipeline')
    results_folder_path.mkdir(parents=True, exist_ok=True)
    print(f'RUN pipeline for {p}')

    ## Load the settings
    settings = load_settings(settings_file_path)

    ## Run the pipeline
    run_pipeline(
        input_folder_path,
        results_folder_path,
        **settings
    )
0%| | 0/7 [00:00<?, ?it/s]
RUN pipeline for C:\Users\Localadmin\Documents\pypocquantui\src\main\python\pyPOCQuantUI\pypocquant\examples\images
100%|████████████████████████████████████████████████████████████████████████████████████| 7/7 [00:10<00:00, 1.52s/it]
Results written to C:\Users\Localadmin\Documents\pypocquantui\src\main\python\pyPOCQuantUI\pypocquant\examples\images\pipeline\quantification_data.csv
Logfile written to C:\Users\Localadmin\Documents\pypocquantui\src\main\python\pyPOCQuantUI\pypocquant\examples\images\pipeline\log.txt
Settings written to C:\Users\Localadmin\Documents\pypocquantui\src\main\python\pyPOCQuantUI\pypocquant\examples\images\pipeline\settings.conf
Pipeline completed.
Read and plot the results
[10]:
results = pd.read_csv(str(Path(p / 'pipeline/quantification_data.csv')))
results
[10]:
| fid | fid_num | filename | extension | basename | iso_date | iso_time | exp_time | f_number | focal_length_35_mm | ... | igm | igm_abs | igm_ratio | igg | igg_abs | igg_ratio | ctl | ctl_abs | ctl_ratio | user | |
|---|---|---|---|---|---|---|---|---|---|---|---|---|---|---|---|---|---|---|---|---|---|
| 0 | H01601828610122 | 1601828610122 | IMG_9067.JPG | .JPG | IMG_9067 | 2020-06-21 | 12-14-03 | [1/10] | [63/10] | -1 | ... | 0 | 0.000000 | 0.000000 | 0 | 0.000000 | 0.000000 | 1 | 1087.000925 | 1.0 | CUNYA |
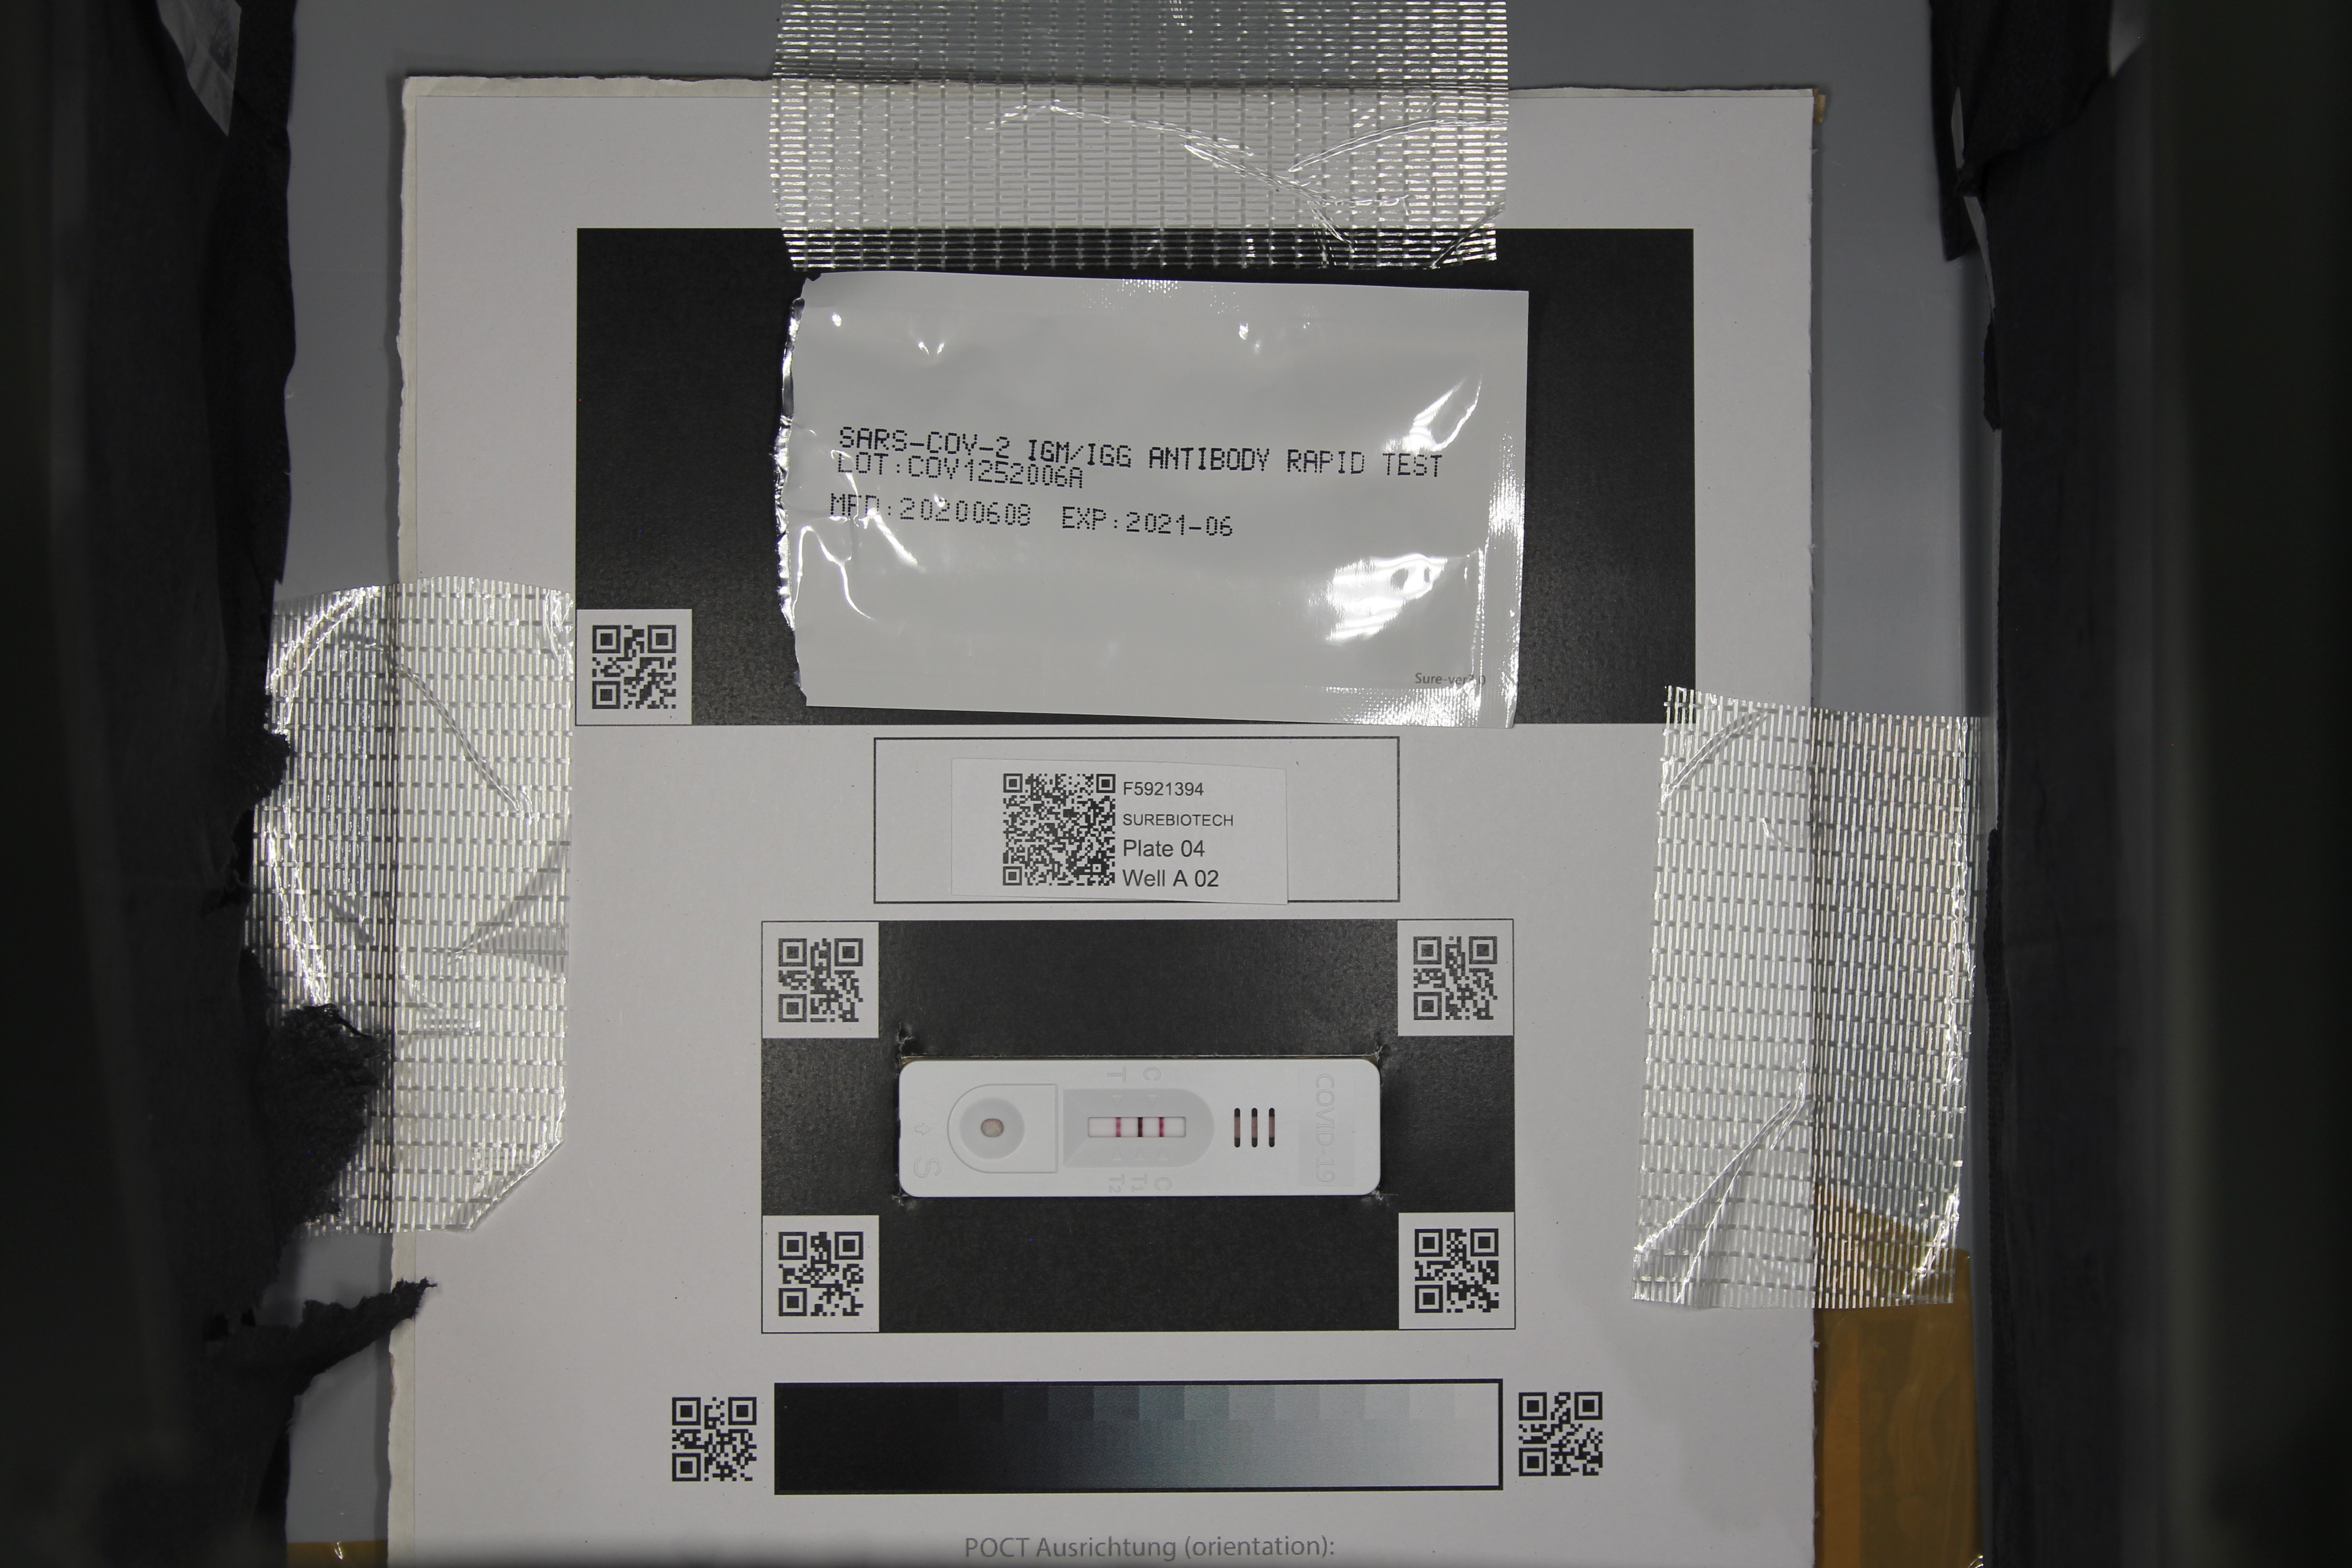
| 1 | F5921394 | 5921394 | IMG_9068.JPG | .JPG | IMG_9068 | 2020-06-21 | 12-14-46 | [1/10] | [63/10] | -1 | ... | 1 | 822.735949 | 0.805935 | 1 | 1443.824091 | 1.414340 | 1 | 1020.846550 | 1.0 | CUNYA |
| 2 | F5922180 | 5922180 | IMG_9069.JPG | .JPG | IMG_9069 | 2020-06-21 | 12-15-07 | [1/10] | [63/10] | -1 | ... | 1 | 200.968865 | 0.194804 | 1 | 1029.903783 | 0.998311 | 1 | 1031.645989 | 1.0 | CUNYA |
| 3 | F5922944 | 5922944 | IMG_9070.JPG | .JPG | IMG_9070 | 2020-06-21 | 12-15-28 | [1/10] | [63/10] | -1 | ... | 0 | 0.000000 | 0.000000 | 1 | 405.080753 | 0.403488 | 1 | 1003.946928 | 1.0 | CUNYA |
4 rows × 25 columns
[11]:
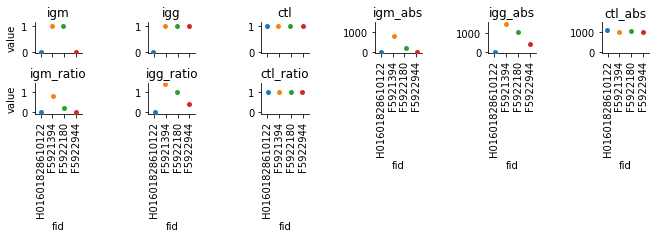
%matplotlib inline
dm = pd.melt(results, id_vars=['fid'], value_vars=['igm', 'igg', 'ctl', 'igm_abs', 'igg_abs', 'ctl_abs', 'igm_ratio', 'igg_ratio', 'ctl_ratio'])
g = sns.catplot(x="fid", y="value", hue="fid", col='variable', col_wrap=6, data=dm, sharey=False, height=1, aspect=1.6)
g.set_xticklabels(rotation=90)

axes = g.axes.flatten()
titles = ['igm', 'igg', 'ctl', 'igm_abs', 'igg_abs', 'ctl_abs', 'igm_ratio', 'igg_ratio', 'ctl_ratio']
limits = [[-0.05,1.15], [-0.05,1.15], [-0.05,1.15], [-80,1500], [-80,1550], [-80,1500],
          [-0.08,1.5], [-0.08,1.5], [-0.08,1.5]]
for ix, ax in enumerate(axes):
    ax.set_title(titles[ix])
    ax.set_ylim(limits[ix])
g.savefig("output.pdf", dpi=300)
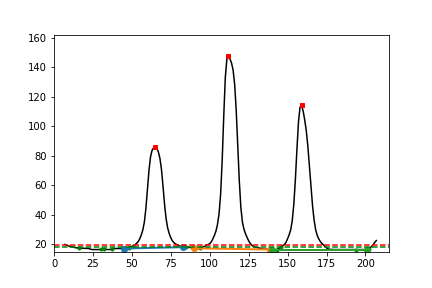
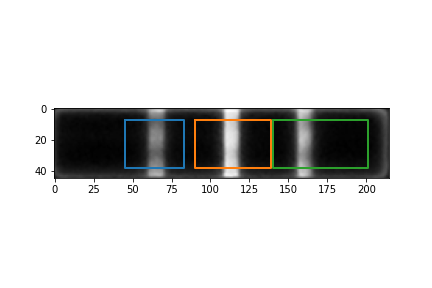
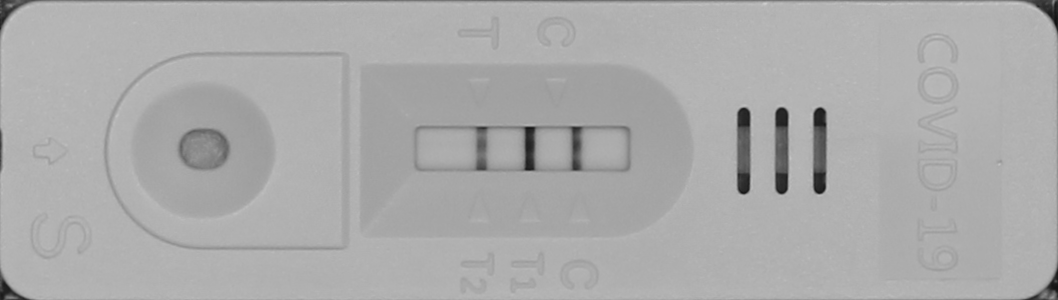
Check the qc images
[12]:
i1 = Image(filename=str(Path(p / 'pipeline/IMG_9068_JPG_peak_analysis.PNG')))
i2 = Image(filename=str(Path(p / 'pipeline/IMG_9068_JPG_peak_overlays.PNG')))
i3 = Image(filename=str(Path(p / 'pipeline/IMG_9068_JPG_strip_gray_aligned.PNG')))
i4 = Image(filename=str(Path(p / 'pipeline/IMG_9068_JPG_rotated.JPG')))
display(i1, i2, i3, i4)
Inspect the log file
[14]:
f = open(str(Path(p / 'pipeline/log.txt')), "r")
print(f.read())
f.close()
File = 20210105_config_run_1.conf

File = IMG_9067.JPG
Processing IMG_9067.JPG
Best percentiles for barcode extraction: (0, 100); best scaling factor = 0.25; score = 6/6
Detected FIDs for rotated image: H01601828610122 H01601828610122
File IMG_9067.JPG: best percentiles for barcode extraction after rotation: (0, 100); best scaling factor = 0.5; score = 6/6
File IMG_9067.JPG: Strip box image rotated by angle -0.285863954857813 degrees using QR code locations.
File IMG_9067.JPG: FID = 'H01601828610122'
File IMG_9067.JPG: sensor coordinates = [126, 171, 423, 638], score = 1.0
Peak 143 has lower bound 99 (d = 44) with relative intensity 0.00 and upper bound 166 (d = 23) with relative intensity 0.00. Band width is 68. Band skewness is 0.52
File IMG_9067.JPG: the bands were 'normal'.
✓ File IMG_9067.JPG: successfully processed and added to results table.

File = IMG_9068.JPG
Processing IMG_9068.JPG
Best percentiles for barcode extraction: (0, 100); best scaling factor = 0.25; score = 6/6
Detected FIDs for rotated image: F5921394 F5921394
File IMG_9068.JPG: best percentiles for barcode extraction after rotation: (0, 100); best scaling factor = 0.25; score = 6/6
File IMG_9068.JPG: Strip box image rotated by angle -0.32740089084438817 degrees using QR code locations.
File IMG_9068.JPG: FID = 'F5921394'
File IMG_9068.JPG: sensor coordinates = [126, 171, 416, 631], score = 1.0
Peak 65 has lower bound 45 (d = 20) with relative intensity 0.00 and upper bound 83 (d = 18) with relative intensity 0.01. Band width is 39. Band skewness is 0.90
Peak 112 has lower bound 90 (d = 22) with relative intensity 0.01 and upper bound 142 (d = 30) with relative intensity 0.00. Band width is 53. Band skewness is 1.36
Peak 159 has lower bound 138 (d = 21) with relative intensity 0.00 and upper bound 201 (d = 42) with relative intensity 0.00. Band width is 64. Band skewness is 2.00
File IMG_9068.JPG: the bands were 'normal'.
✓ File IMG_9068.JPG: successfully processed and added to results table.

File = IMG_9069.JPG
Processing IMG_9069.JPG
Best percentiles for barcode extraction: (0, 100); best scaling factor = 0.5; score = 6/6
Detected FIDs for rotated image: F5922180 F5922180
File IMG_9069.JPG: best percentiles for barcode extraction after rotation: (0, 100); best scaling factor = 0.5; score = 6/6
File IMG_9069.JPG: Strip box image rotated by angle -0.28627203365974213 degrees using QR code locations.
File IMG_9069.JPG: FID = 'F5922180'
File IMG_9069.JPG: sensor coordinates = [126, 171, 416, 631], score = 1.0
Peak 65 has lower bound 43 (d = 22) with relative intensity 0.00 and upper bound 79 (d = 14) with relative intensity 0.03. Band width is 37. Band skewness is 0.64
Peak 112 has lower bound 89 (d = 23) with relative intensity 0.00 and upper bound 143 (d = 31) with relative intensity 0.00. Band width is 55. Band skewness is 1.35
Peak 158 has lower bound 133 (d = 25) with relative intensity 0.00 and upper bound 200 (d = 42) with relative intensity 0.00. Band width is 68. Band skewness is 1.68
File IMG_9069.JPG: the bands were 'normal'.
✓ File IMG_9069.JPG: successfully processed and added to results table.

File = IMG_9070.JPG
Processing IMG_9070.JPG
Best percentiles for barcode extraction: (0, 100); best scaling factor = 0.25; score = 6/6
Detected FIDs for rotated image: F5922944 F5922944
File IMG_9070.JPG: best percentiles for barcode extraction after rotation: (0, 100); best scaling factor = 0.5; score = 6/6
File IMG_9070.JPG: Strip box image rotated by angle -0.4086648209901469 degrees using QR code locations.
File IMG_9070.JPG: FID = 'F5922944'
File IMG_9070.JPG: sensor coordinates = [126, 171, 424, 639], score = 1.0
Peak 96 has lower bound 76 (d = 20) with relative intensity 0.01 and upper bound 122 (d = 26) with relative intensity 0.00. Band width is 47. Band skewness is 1.30
Peak 141 has lower bound 122 (d = 19) with relative intensity 0.01 and upper bound 190 (d = 49) with relative intensity 0.00. Band width is 69. Band skewness is 2.58
File IMG_9070.JPG: the bands were 'normal'.
✓ File IMG_9070.JPG: successfully processed and added to results table.

File = pipeline

File = test
c:\users\localadmin\appdata\local\programs\python\python36\lib\site-packages\ipykernel_launcher.py:1: ResourceWarning: unclosed file <_io.TextIOWrapper name='C:\\Users\\Localadmin\\Documents\\pypocquantui\\src\\main\\python\\pyPOCQuantUI\\pypocquant\\examples\\images\\pipeline\\log.txt' mode='r' encoding='cp1252'>
  """Entry point for launching an IPython kernel.