Welcome to pyPOCQuant’s documentation!
The tool pyPOCQuant aims to automatically detect and quantify signal bands from lateral flow assays (LFA) or Point of Care tests (POC or POCT) from an image. It can batch analyze large amounts of images in parallel. An analysis pipeline can be run either from the command line (good for automating large numbers of analysis) or from a desktop application.
Contents:

pyPOCQuant - A tool to automatically quantify Point-Of-Care Tests from images
![]() This repository contains the implementation of pyPOCQuant to automatically detect and quantify test line (TL) signal bands from lateral flow assays (LFA) images, as described in the paper:
This repository contains the implementation of pyPOCQuant to automatically detect and quantify test line (TL) signal bands from lateral flow assays (LFA) images, as described in the paper:
Cuny, A. P., Rudolf, F., & Ponti, A. (2020). pyPOCQuant - A tool to automatically quantify Point-Of-Care Tests from images. SoftwareX,. https://doi.org/10.1016/j.softx.2021.100710
Please cite the paper(s) if you are using this code in your research or work.
Overview
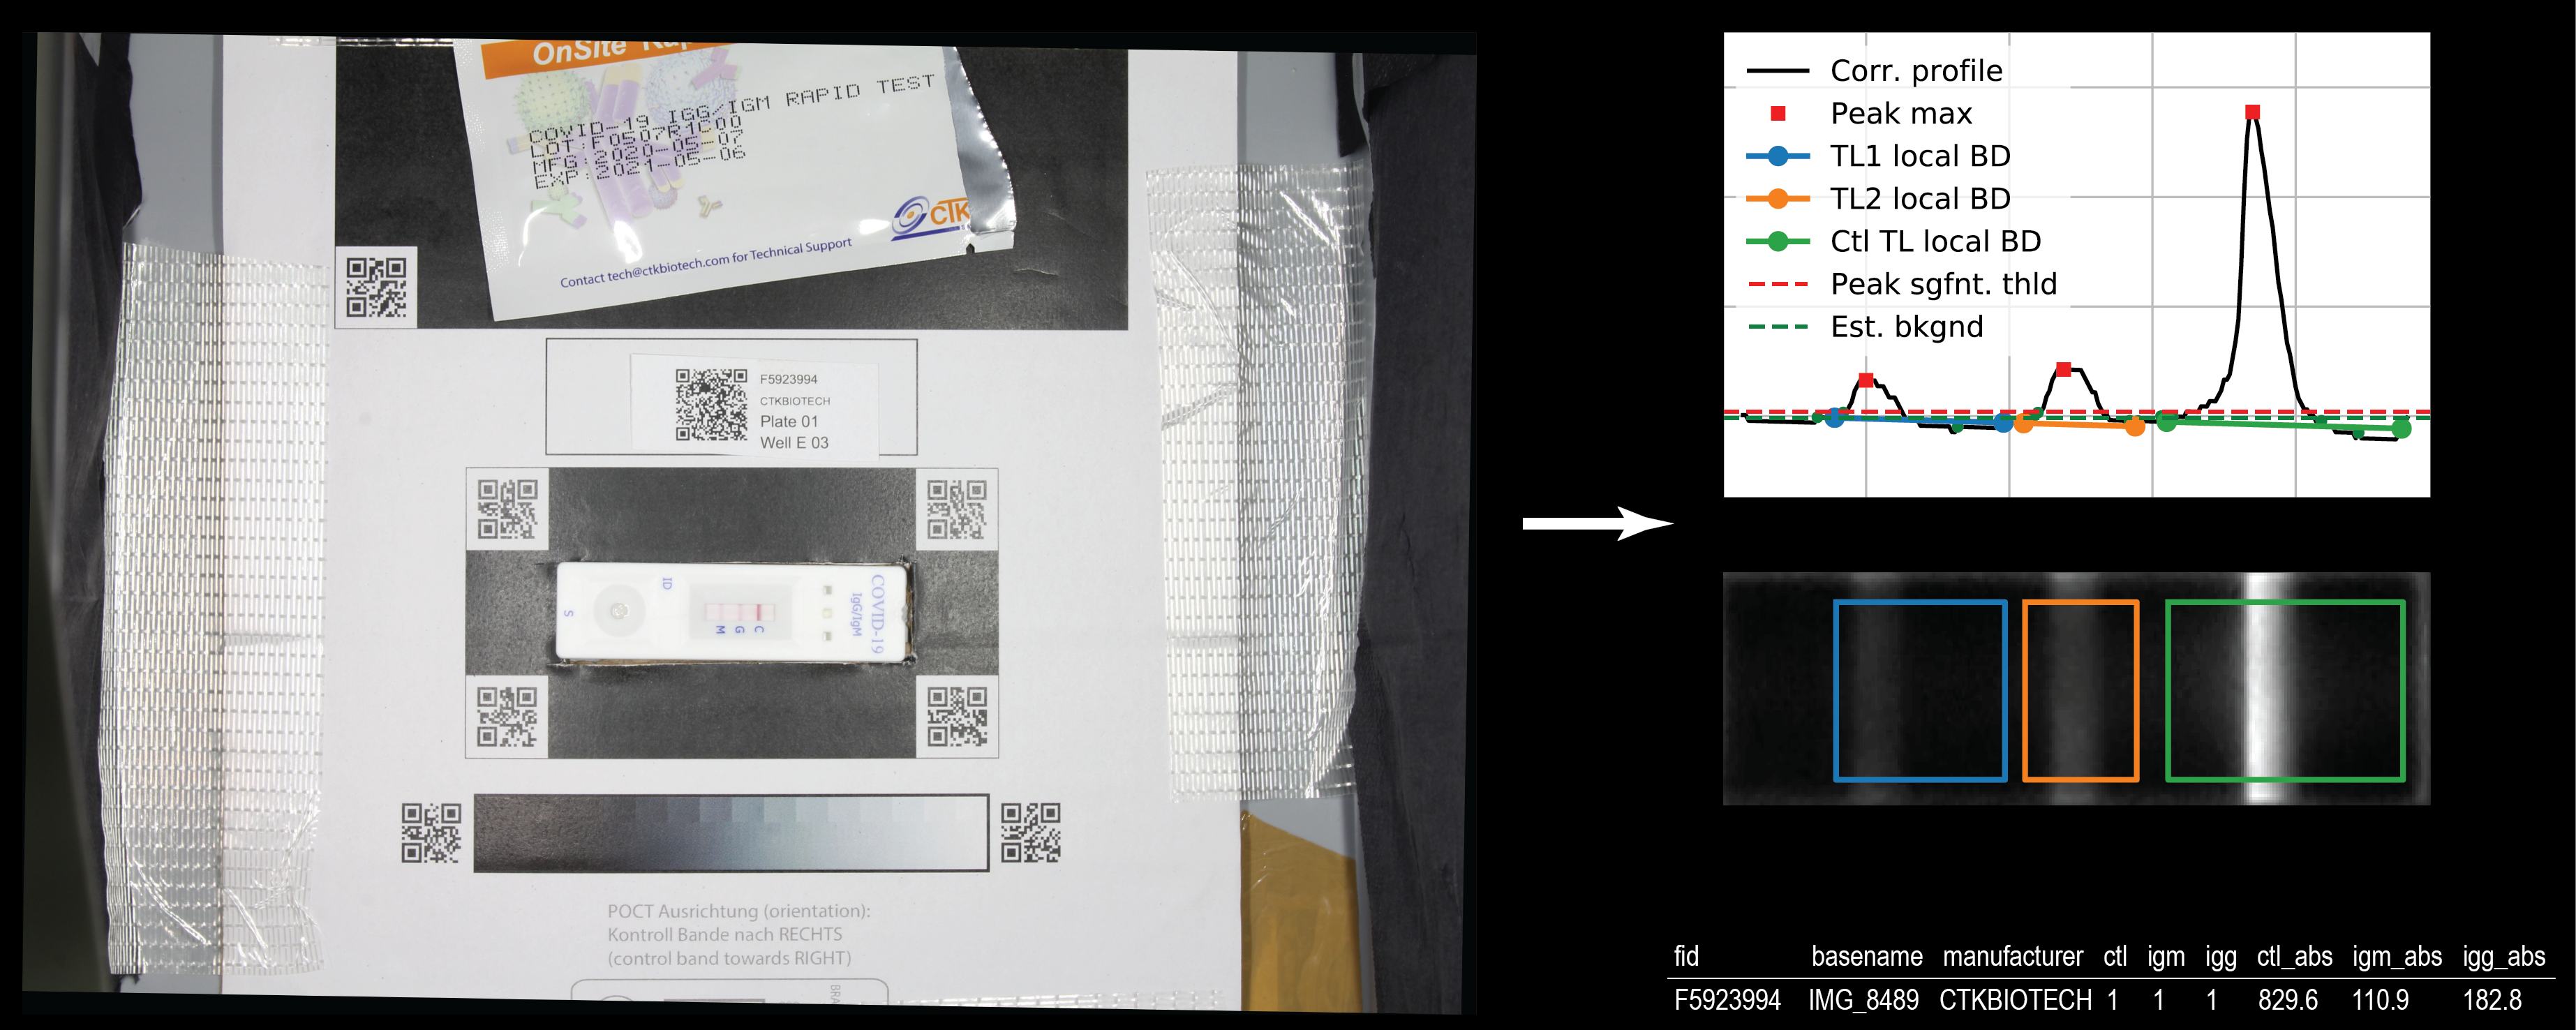
We developed pyPOCQuant to quantify lateral flow assays (LFA) based Point of Care tests (POCT) from images. The above figure shows an image of a POCT placed on our QR code template as well as a QR code label providing metadata about the sample and test. The POCT gets extracted from the QR code box and finely aligned prior to the detection of the test lines (TLs) from the sensor area. The TLs and their signal strength get quantified after a background subtraction and the results are compiled in a table along with the metadata of the tests automatically for each image.
For a more detailed description please read the user manual or the paper.
Installation
This package requires Python 3.6 and runs on various platforms. If not explicitly stated differently all the steps below are the same on each platform.
Install | run compiled binaries
The easiest way to run pyPOCQuant is to use the compiled binaries which includes everything (except tesseract and zbar, see below) ready to be used.
Install python and all requirements | run from source
Windows
Linux
Install the following dependences (instructions for Ubuntu Linux):
$ sudo apt install libzmq3-dev, tesseract-ocr, libzbar0
macOS
To install the required dependencies we recommend to use the packaging manager brew. Install it from here if you have’t allready Install brew.
$ brew install zbar
$ brew install tesseract
All platforms
pyPOCQuant requires python 3.6. It is recommended to use miniconda: https://docs.conda.io/en/latest/miniconda.html. When miniconda is installed, start the terminal and type:
# Create and activate an environment
$ conda create -n pypocquant python=3.6
$ conda activate pypocquant
Clone the repo.
git clone git://git.gitlab.com/csb.ethz/pypocquantui.git
Then, install all requirements.
$ cd ${pyPOCQuantUI_root_folder}
$ pip install -r requirements/${platform}
where ${platform} is one of win32.txt, linux.txt, or osx.txt.
Run the GUI with (from within ${pyPOCQuantUI_root_folder}):
$ fbs run
For other ways to use pyPOCQuant please read the documentation.
Build pyPOCQuantUI
To compile and create a pyPOCQuantUI installer, perform following steps. In the following {ppcqui_root} points to the root folder of the pyPOCQuantUI checked-out code.
Windows
$ cd ${ppcqui_root}
$ python ./make_build.py
You will find the installer in ${ppcqui_root}\target\pyPOCQuant.
Linux
$ sudo apt install ruby ruby-dev rubygems build-essential
$ sudo gem install --no-document fpm
$ cd ${ppcqui_root}
$ python ./make_build.py
This will create a ${ppcqui_root}/target/pyPOCQuant/pyPOCQuant.deb package that can be installed and redistributed.
sudo apt install ${ppcqui_root}/target/pyPOCQuant/pyPOCQuant.deb
Please notice that client machines will need to install also two dependences:
sudo apt install tesseract-ocr, libzbar0
sudo apt install ${ppcqui_root}/target/pyPOCQuant/pyPOCQuant.deb
macOS
$ cd ${ppcqui_root}
$ python ./make_build.py
Notes
Depending on your Python installation, you may need to use
pip3instead ofpip.For both running it from source or with the compiled binaries
zbarandtesseractneeds to be installed and be on PATH. On Windowszbarlibs are installed automatically.
Usage
We provide an example workflow in a Jupyter notebook that illustrate how this library can be used as well as a step by step QuickStart (add link) guide in the documentation.
Example data
We provide example data as well as an example configuration in this repo under:
examples/config.conf
examples/images
Creating a config file
In the following we present a brief overview how to create a working config file for your images. Detailed instructions and the definition of each parameter can be found in detail in the manual and documentation. We show how to obtain position and extent of the sensor areas in Fiji or ImageJ. Later we will see how to do the same in the pyPOCQuant user interface (GUI).
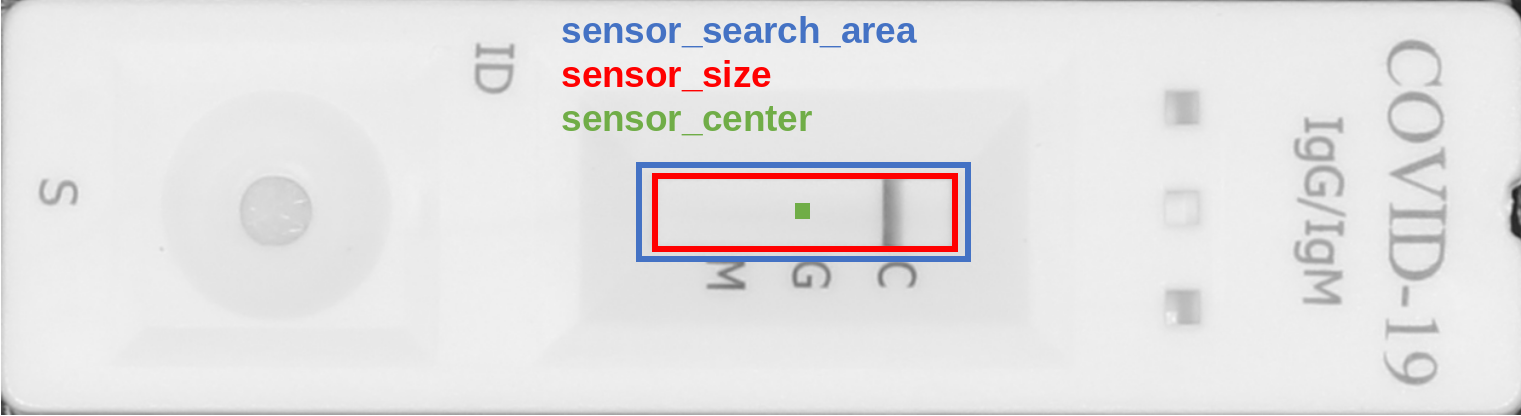
Important parameters are the sensor_size, sensor_center, and sensor_search_area (the latter being an advanced parameter).
Creating a config file with Fiji
Open a settings file (i.e default settings) and adjust the parameters to fit your images.
Load an image with Fiji and crop it to the size of the POCT

After drawing a rectangular region of interest, the size is displayed in Fiji’s toolbar; e.g.
x=539, y=145, **w=230, h=62**.When hovering over the central pixels in the top or left sides of the selection, the
x, andycoordinates of the center, respectively, are show in Fiji’s toolbar; e.g.x=*601*, y=144, value=214(and equivalently fory).
With the line tool the distance from the border to the test lines (TLs) can be measured and expressed as relative ration (distance to TL from left border / w) to obtain the
peak_expected_relative_location.
Creating a config file with the GUI
A settings file must not necessarily be created in advance. The Parameter Tree can be edited directly. Optionally, settings can be loaded or saved from the UI.
Select the input folderand click on one of the listed images to display it. The POCT region will be automatically extracted and shown in the view at the top. The lower view shows the whole image.Hit the
Draw sensor outlineicon (red arrow) in the toolbar. This will allow you to interactively define thesensor areaand thepeak_expected_relative_locationparameters.
Drawing sensor by clicking into the corners |
Drawing finished with aligned test lines (vertical lines) |
|---|---|
|
|
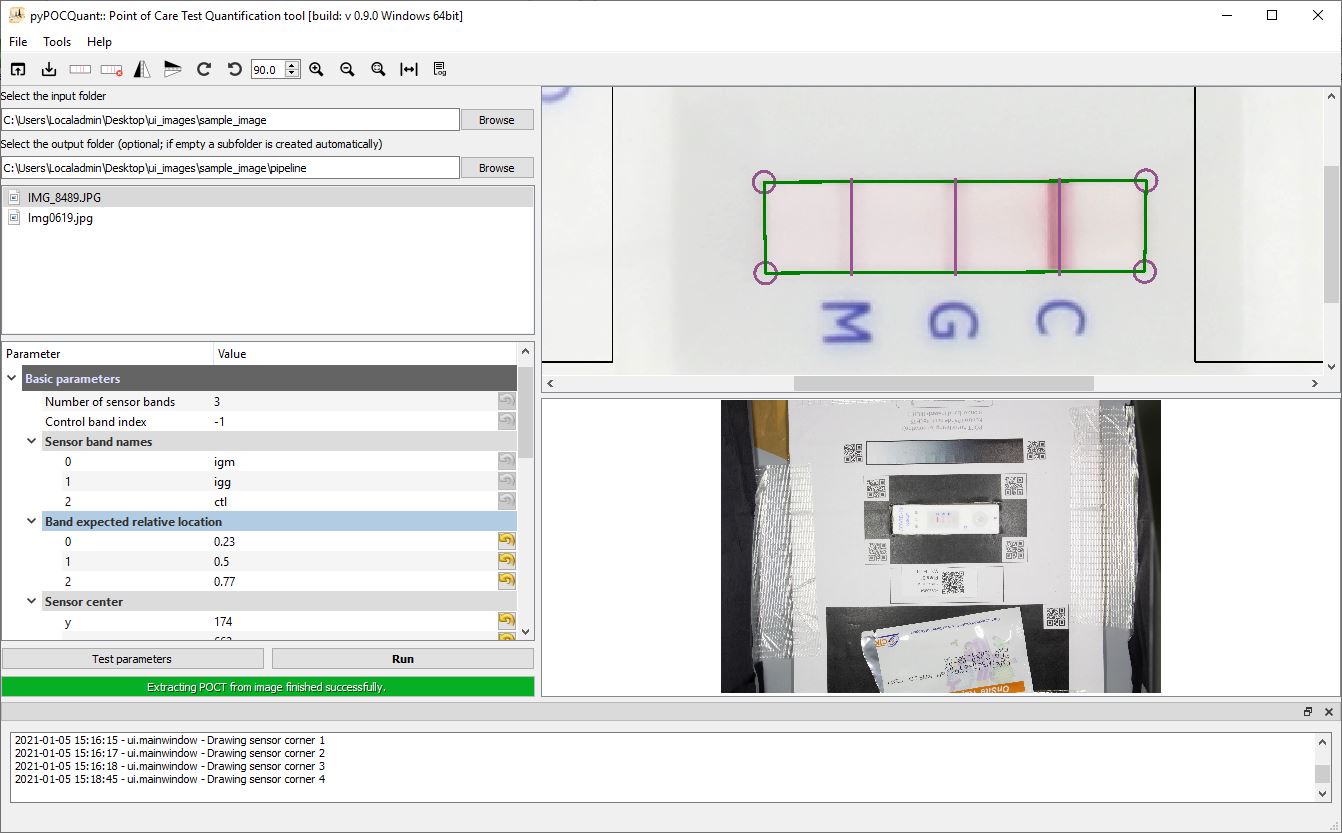
Draw the four corners of the sensor and place the vertical bars on the test lines (TLs). This will cause all relevant parameters to be populated in the Parameter Tree. Please notice that, by default, the
sensor_search_areais set to be 10 pixels wider and taller than thesensor_size. This can be changed in the advanced parameters (but beware to keep it only slightly larger than thesensor_size: it is meant only for small refinements).
Save the settings file (Ctrl+S,
File->Save settings file) or test current parameters on one image by clicking theTest parametersbutton under the Parameter Tree.
Minimal example
Create a Python script or Jupyter notebook cell with the following code to run the pipeline on all images for a given input_folder_path.
from pypocquant.lib.pipeline import run_pipeline
from pypocquant.lib.settings import default_settings

# Get the default settings
settings = default_settings()

# Change settings manually as needed
settings["sensor_band_names"] = ('igm', 'igg', 'ctl')

# Alternatively, load existing settings file
# from pypocquant.lib.settings import load_settings
# settings = load_settings('full/path/to/settings/file.conf')

# Set final argument
input_folder_path = 'full/path/to/input/folder'
results_folder_path = 'full/path/to/results/folder'
max_workers = 8

# Run the pipeline
run_pipeline(
    input_folder_path,
    results_folder_path,
    **settings,
    max_workers=max_workers
)
Command line interface (CLI)
Running pyPOCQuant from the CLI is best suited when automating the processing of large amounts of images and folders.
To create a default configuration from the CLI, use the -c flag of pyPOCQuant.py.
python pyPOCQuant.py −c /PATH/TO/CONFIG/FILE.conf
By far the easiest approach is to use the pyPOCQuantUI (GUI) for this purpose, but it could also be done with other tools, such as Fiji (as described in the manual).
Once the configuration file is ready, a full study can be started by running pyPOCQuant on a full folder of images The analysis is performed in parallel, and the number of concurrent tasks can be adjusted by the -w (--workers) argument.
python pyPOCQuant.py −f /PATH/TO/INPUT/FOLDER −o /PATH/TO/RESULTS/FOLDER −s /PATH/TO/CONFIG/FILE −w ${NUMWORKERS}
**
-f**/PATH/TO/INPUT/FOLDER/MANUFACTURER: path to the folder that contains all images for a given camera and manufacturer.**
-o**/PATH/TO/RESULTS/FOLDER: path where the results (and the quality control images) for a given camera and manufacturer will be saved. The results are saved in aquantification_data.csvtext file.**
-s**/PATH/TO/CONFIG/FILE: path to the configuration file to be used for this analysis. Note that a configuration file will be needed per manufacturer and (possibly) camera combination.**
-w**NUM_WORKERS: number of parallel processes; e.g.8.**
-h**HELP: displays the CLI arguments and their usage.
To run it with the provided example data type:
python pyPOCQuant.py −f examples/images −o examples/images/results −s examples/config.conf −w 4
Graphical user interface (GUI)
We also provide a graphical user interface pyPOCQuantUI that enables interactive parameter configuration, parameter testing, and parallel processing of all files in a folder. The UI also offers a graphical tool to create custom sample identifier QR codes, and another to split images by vendor (either by keyword or QR code tag).
Detailed installation and usage instructions can be found in the manual and documentation.
To start the GUI from source navigate into the pyPOCQuantUI root folder and run:
fbs run
or double click on the pyPOCQuant icon installed by the installer or directly on the downloaded binaries.
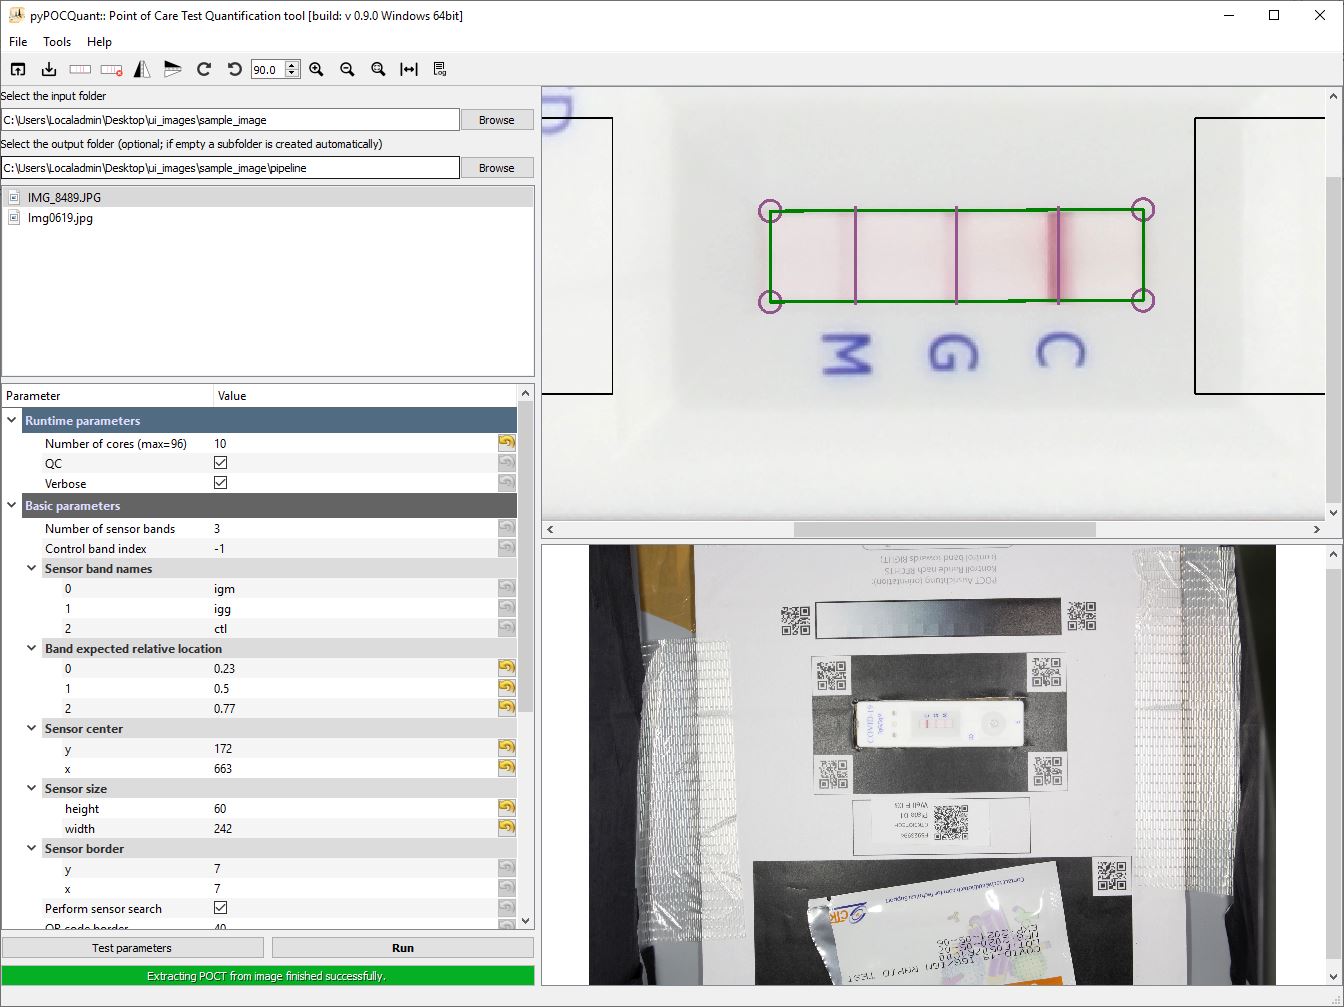
After selecting the INPUT FOLDER and clicking on an image (e.g. IMG_9068.JPG in the figure below), the POCT gets extracted and displayed on the right top. Clicking on the Draw sensor button (red arrow) allows to identify the sensor area by clicking into its corners. After aligning the relative position of the test lines (TLs) by dragging the vertical lines the button Test parameters will open the OUTPUT FOLDER and show the results for the selected image. Clicking the button **Run** will apply the parameters to all images in the selected folder and process each image in parallel.
Troubleshooting
Installation requires Python 3.6 , PyQT 5 and fbs 0.9 with PyInstaller 3.4. We have tested the package on (macOS, Linux, Windows 7 and 10) Please open an issue if you have problems that are not resolved by our installation guidelines above.
Contributors ✨
pyPOCQuant is developed by Andreas P. Cuny and Aaron Ponti. If you want to contribute and further develop the project feel free to do so!
 Andreas P. Cuny 📆💻 🎨 🤔🚇 |
 Aaron Ponti 📆💻 🎨 🤔🚇 |
How to cite
@article{Cuny2021,
abstract = {Lateral flow Point-Of-Care Tests (POCTs) are a valuable tool for rapidly detecting pathogens and the associated immune response in humans and animals. In the context of the SARS-CoV-2 pandemic, they offer rapid on-site diagnostics and can relieve centralized laboratory testing sites, thus freeing resources that can be focused on especially vulnerable groups. However, visual interpretation of the POCT test lines is subjective, error prone and only qualitative. Here we present pyPOCQuant, an open-source tool implemented in Python 3 that can robustly and reproducibly analyze POCTs from digital images and return an unbiased and quantitative measurement of the POCT test lines.},
author = {Cuny, Andreas P. and Rudolf, Fabian and Ponti, Aaron},
doi = {10.1016/j.softx.2021.100710},
issn = {23527110},
journal = {SoftwareX},
keywords = {Computer vision,Diagnostics,Lateral flow assay (LFA),Lateral flow immunoassay (LFIA),Point of care test (POCT),QR code,Rapid diagnostic tests (RTD),Rapid testing,Readout zone quantification,Test line quantification},
pages = {100710},
publisher = {Elsevier B.V.},
title = {{pyPOCQuant — A tool to automatically quantify Point-Of-Care Tests from images}},
url = {https://doi.org/10.1016/j.softx.2021.100710},
volume = {15},
year = {2021}
}